
Histograms, Box Plots, and Measures of Center & Spread

Our school has made the jump to online testing! So you know what that means...DESMOS! 

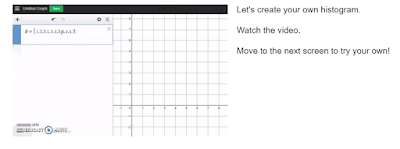
I wanted to show the students how Desmos could create histograms and box plots. Then I got the idea to allow students to find the mean, median, and standard deviation too. 

So I created this Desmos activity as a tutorial & practice for those topics. The activity ends with a card sort where they must match the mean, median and standard deviation to a histogram and box plot. I also included some multiple choice and open ended questions just as a review. I allowed them to use the Desmos calculator to assist in answering the questions. 

I will say that my students aren't making the jump to Desmos so easily. They still can't let the handheld calculator go...but at least I'm trying! 

Here is the activity if you would like to try this out in your classroom: Activity 
yay
~RJ


Comments

Popular posts from this blog

Exponential Growth & Decay Scavenger Hunt

Scavenger Hunts are always fun (and easy to grade). This particular one is all about applications of exponential growth & decay. My students seem to understand this topic really well, but I still wanted to provide more practice.  When I did this hunt originally, I created the cards with the answer on the front and the question on the back. Once I figured out how to copy and make it work, it was great because I could use the cards over and over again. However, they started looking old, and I lost some of the cards. So t his year, I placed the answer and question on the front. It made it so much easier to copy!  If you would like to try this in your class, here is a copy ! I included the solutions as well.  UPDATE: I created this activity and transformed into a remote version.  Remote Version: SE Scavenger Hunt               TE Scavenger Hunt ~RJ

Modeling Exponential Growth (M&M Activity)

I could present an application problem on the board, have the students plug into their calculator and find the exponential regression equation. However, I think that visualizing the growth is more effective, and allows students to see how fast something like cancer cells can grow. This activity provides a hands on experience with M&Ms while modeling real world concepts.  I found this activity here , but created my own (slightly different) version. I only had enough time for exponential growth, so I eliminated the decay portion.  I really like how students compare the equation that they found to the calculator's regression model. This activity also causes students to discuss each component of the equation, which I think is very important in AFM. Additionally, this brings up a great discussion regarding cancer cells. Do all cancer cells grow exponentially? If time allows, I like for students to do some research (using their phones) to aid with this conversation....

Limit Project

Well...we just got back into school after being out for almost 3 weeks because of hurricane Florence. Our school is okay, but there are many people out there suffering from losing so much. :(  I had planned on a project for Calculus before the storm but will have to put that aside until next year! We have just lost too much time. However, I wanted to still share the project with you guys in case you would like to try it or something similar to it.   I like to make projects a unique experience. I hate when all students do the same thing. #1 - students can and WILL copy. #2 - It's boring to grade!  The idea of this project is floating somewhere on the web. I honestly can't remember where I got the idea. But I have altered it over the years to meet the needs of my students. It has gone through many alterations, and I will continue to change things.  So it is not perfect!  The gist - students find a recipe that has at least 5 ingredients. (The recipe ...